Class Profile for the Full-Time MBA Class of 2026
GMAT scores, industry expertise, average GPA, years of work experience — our MBA students' backgrounds make up a diverse class.
156 Students
31%
Women
11%
LGBTQIA+
39%
International Citizens
52%
Minorities *
25%
Underrepresented Minorities *
22%
Military & Veterans *
* Includes U.S. citizens and permanent residents onlyU.S. Minorities: identify as American Indian/Alaska Native, Asian, Black/African American, Hispanic/Latino, Native Hawaiian/Pacific Islander, or multiethnicU.S. Underrepresented Minorities: identify as American Indian/Alaska Native, Black/African American, Hispanic/Latino, Native Hawaiian/Pacific Islander, or multiethnic
25 Countries Represented
Argentina
Brazil
Canada
China
Colombia
Ghana
Hong Kong S.A.R.
India
Indonesia
Ireland
Japan
Lebanon
Luxembourg
Mexico
Morocco
Nepal
Nigeria
Pakistan
Poland
Singapore
South Korea
Switzerland
Taiwan
Thailand
United States
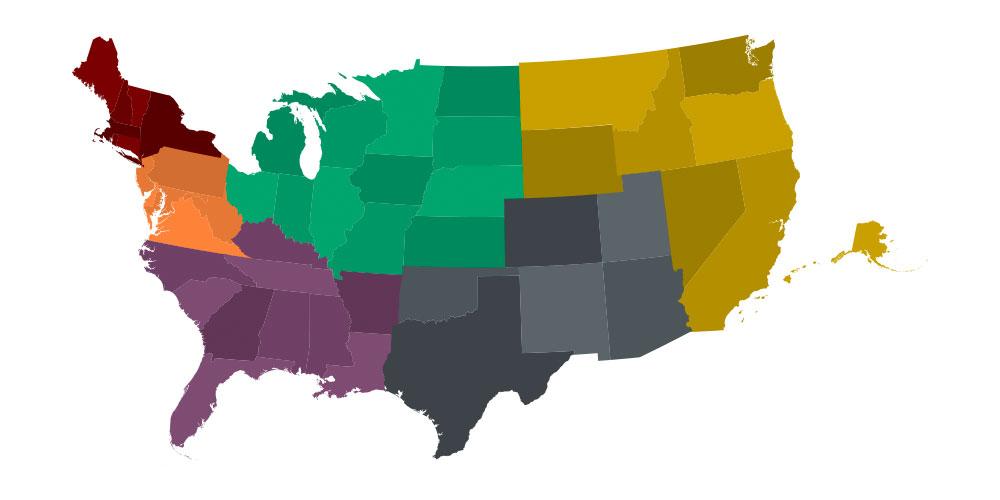
U.S. Residency

Age
29
Average
25-35
Middle 80%
GPA
3.26
Average
3.25
Median
2.92-3.76
Middle 80%
Undergraduate Majors
GMAT
697
Average
700
Median
640-740
Middle 80%
GRE
323
Average
324
Median
314-332
Middle 80%
EA
154
Average
155
Median
150-157
Middle 80%
Work Experience
6.3
Average Years
5.7
Median Years
3.0-10.5
Middle 80% Range
1%
Less Than One Year
Industry Experience
The Tepper School of Business adopts the GME Admissions Reporting Standards and complies with all reporting requirements for all of our MBA programs.
